PPG - Heart Rate and Heart Rate Variability Sensing
2024
PPG - Heart Rate and Heart Rate Variability Sensing
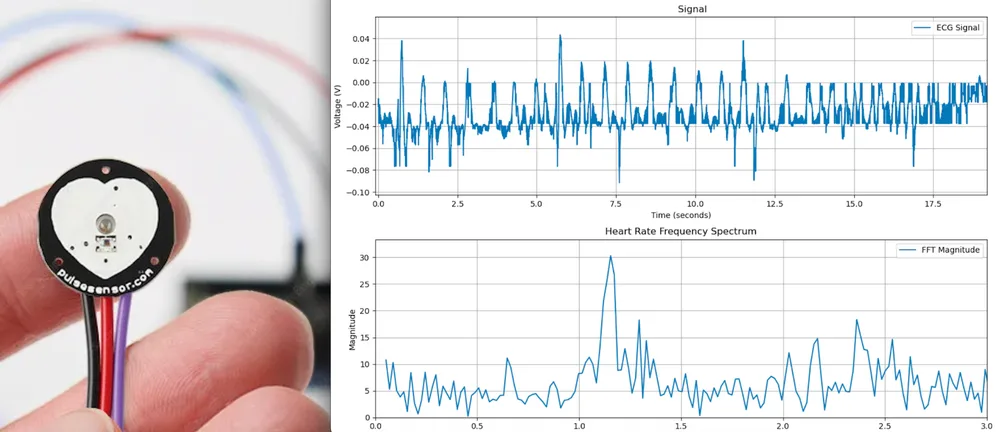
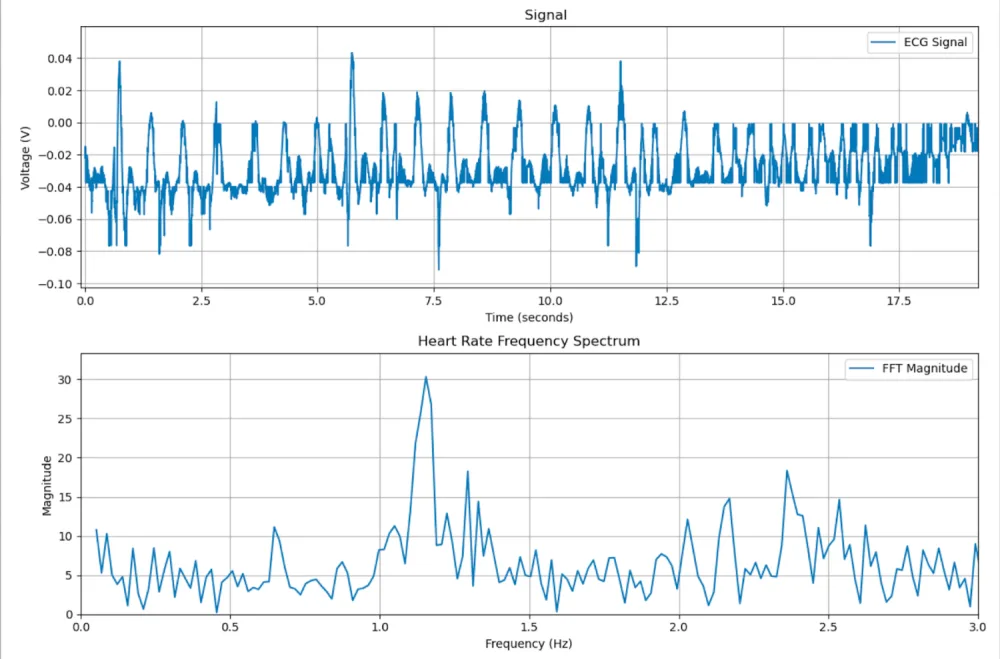
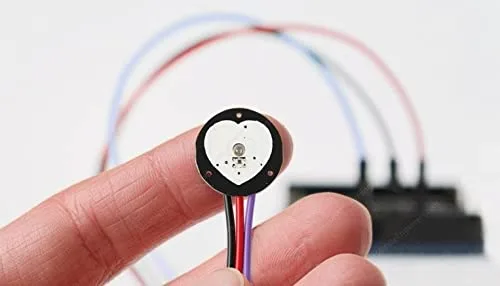
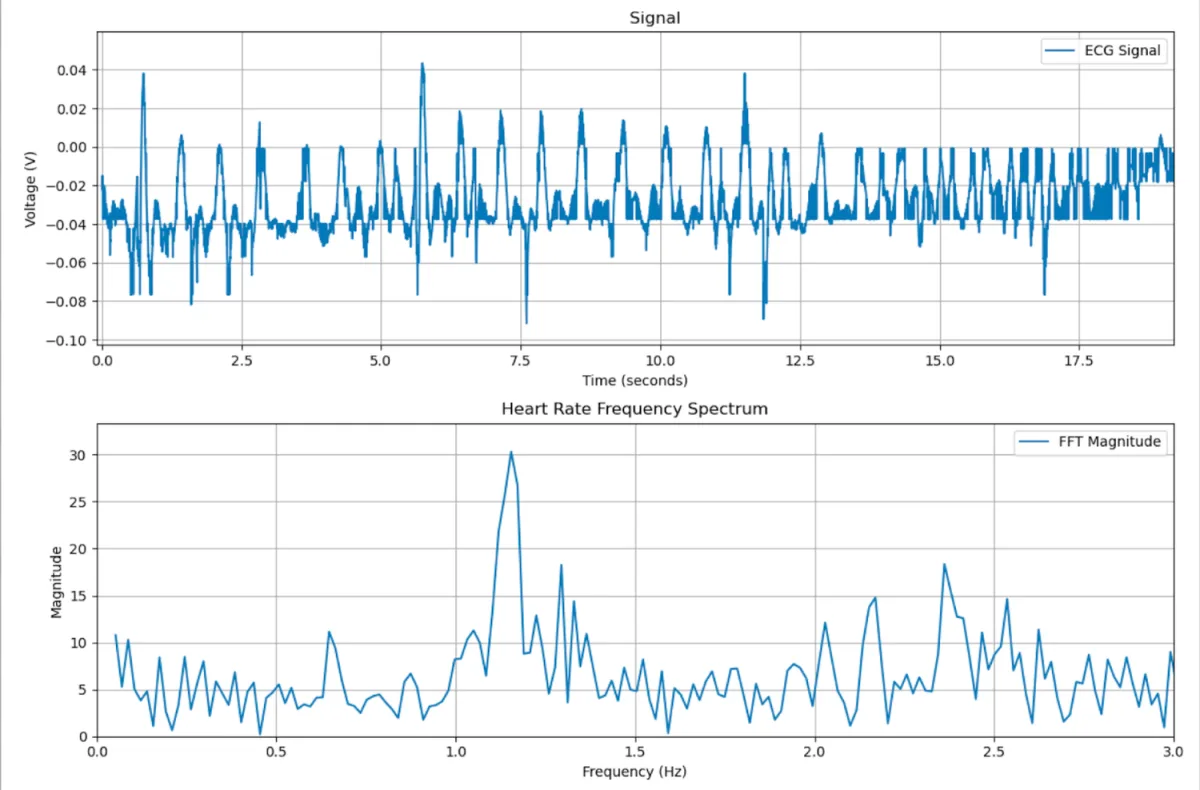
Using a fingertip PPG sensor and AD/DA board, we wrote an algorithm to record heart rate data with minimal noise. We performed an FFT analysis to determine the peak heart rate, and also computed HRV from the time-domain signal.
Description
- Built a Raspberry Pi–based photoplethysmography (PPG) system using the APDS-9008 light sensor to measure heart rate, heart rate variability (HRV), and recovery time.
- Tuned ADC gain and sampling frequency (400 Hz) to avoid clipping and balance noise vs. resolution.
- Collected time-domain data, applied FFT with windowing to extract HR frequency, and analyzed motion artifacts and sensor placement.
- Demonstrated that fingertip placement yields strong, high-SNR signals, while wrist-based sensing suffers due to physiological and geometric limitations.
- Implemented HRV analysis using scipy to calculate max and RMS HRV, showing data quality sensitivity to duration and motion.
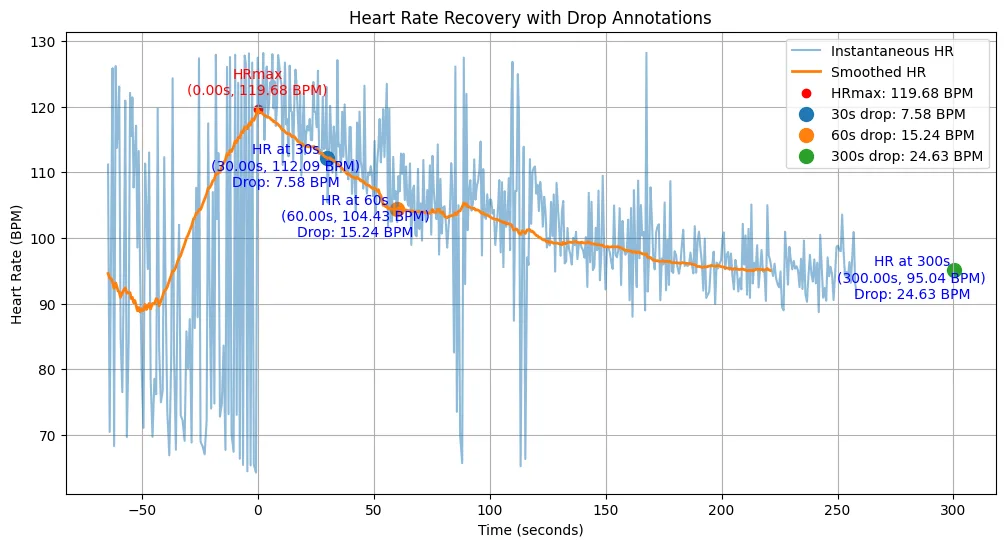
- Modeled heart rate recovery after exercise with an exponential decay fit to estimate cardiovascular recovery time constant (τ ≈ 87 s).
Learning Outcomes
1. Technical Skills & Knowledge
- Raspberry Pi data acquisition and CSV-based data logging
- Analog signal tuning: sampling theory, gain, and anti-aliasing
- Spectral analysis using FFT with manual windowing
- HR/HRV algorithms and signal quality assessment
- Modeling physiological data with exponential fits
- Sensor placement design and physiological considerations
2. General Project/Practical Skills
- Experimental Design: Sensor calibration, testing across body sites, noise control
- Data Analysis: Signal processing in Python, noise filtering, HR trend extraction
- Troubleshooting: Diagnosed issues like clipping, rocking artifacts, and poor SNR
- Scientific Reporting: Interpreting results and drawing insights from noisy biological signals
Full report: https://docs.google.com/document/d/1tX6Lmd7nr55QGjw1kg2u0-U8ADkBJtfbc22XSABrc0g/edit?usp=sharing