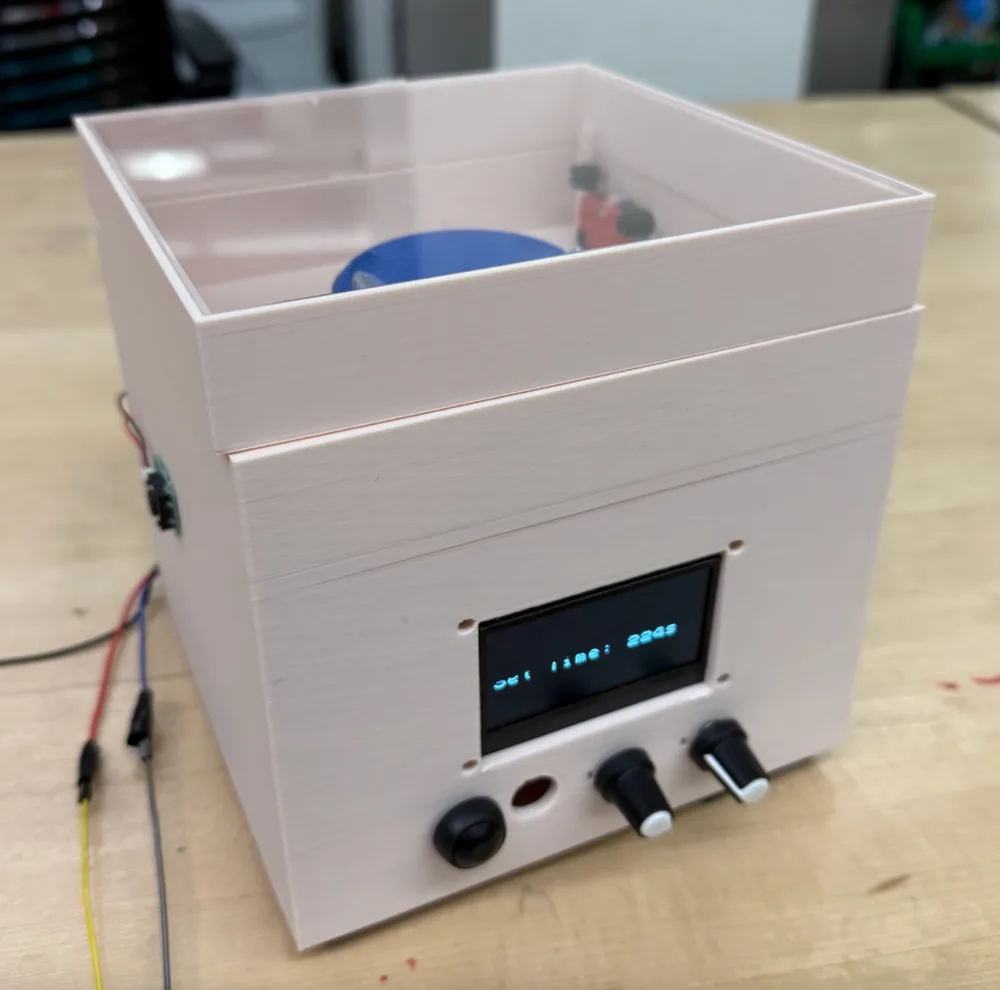
3000RPM mini medical centrifuge
2025
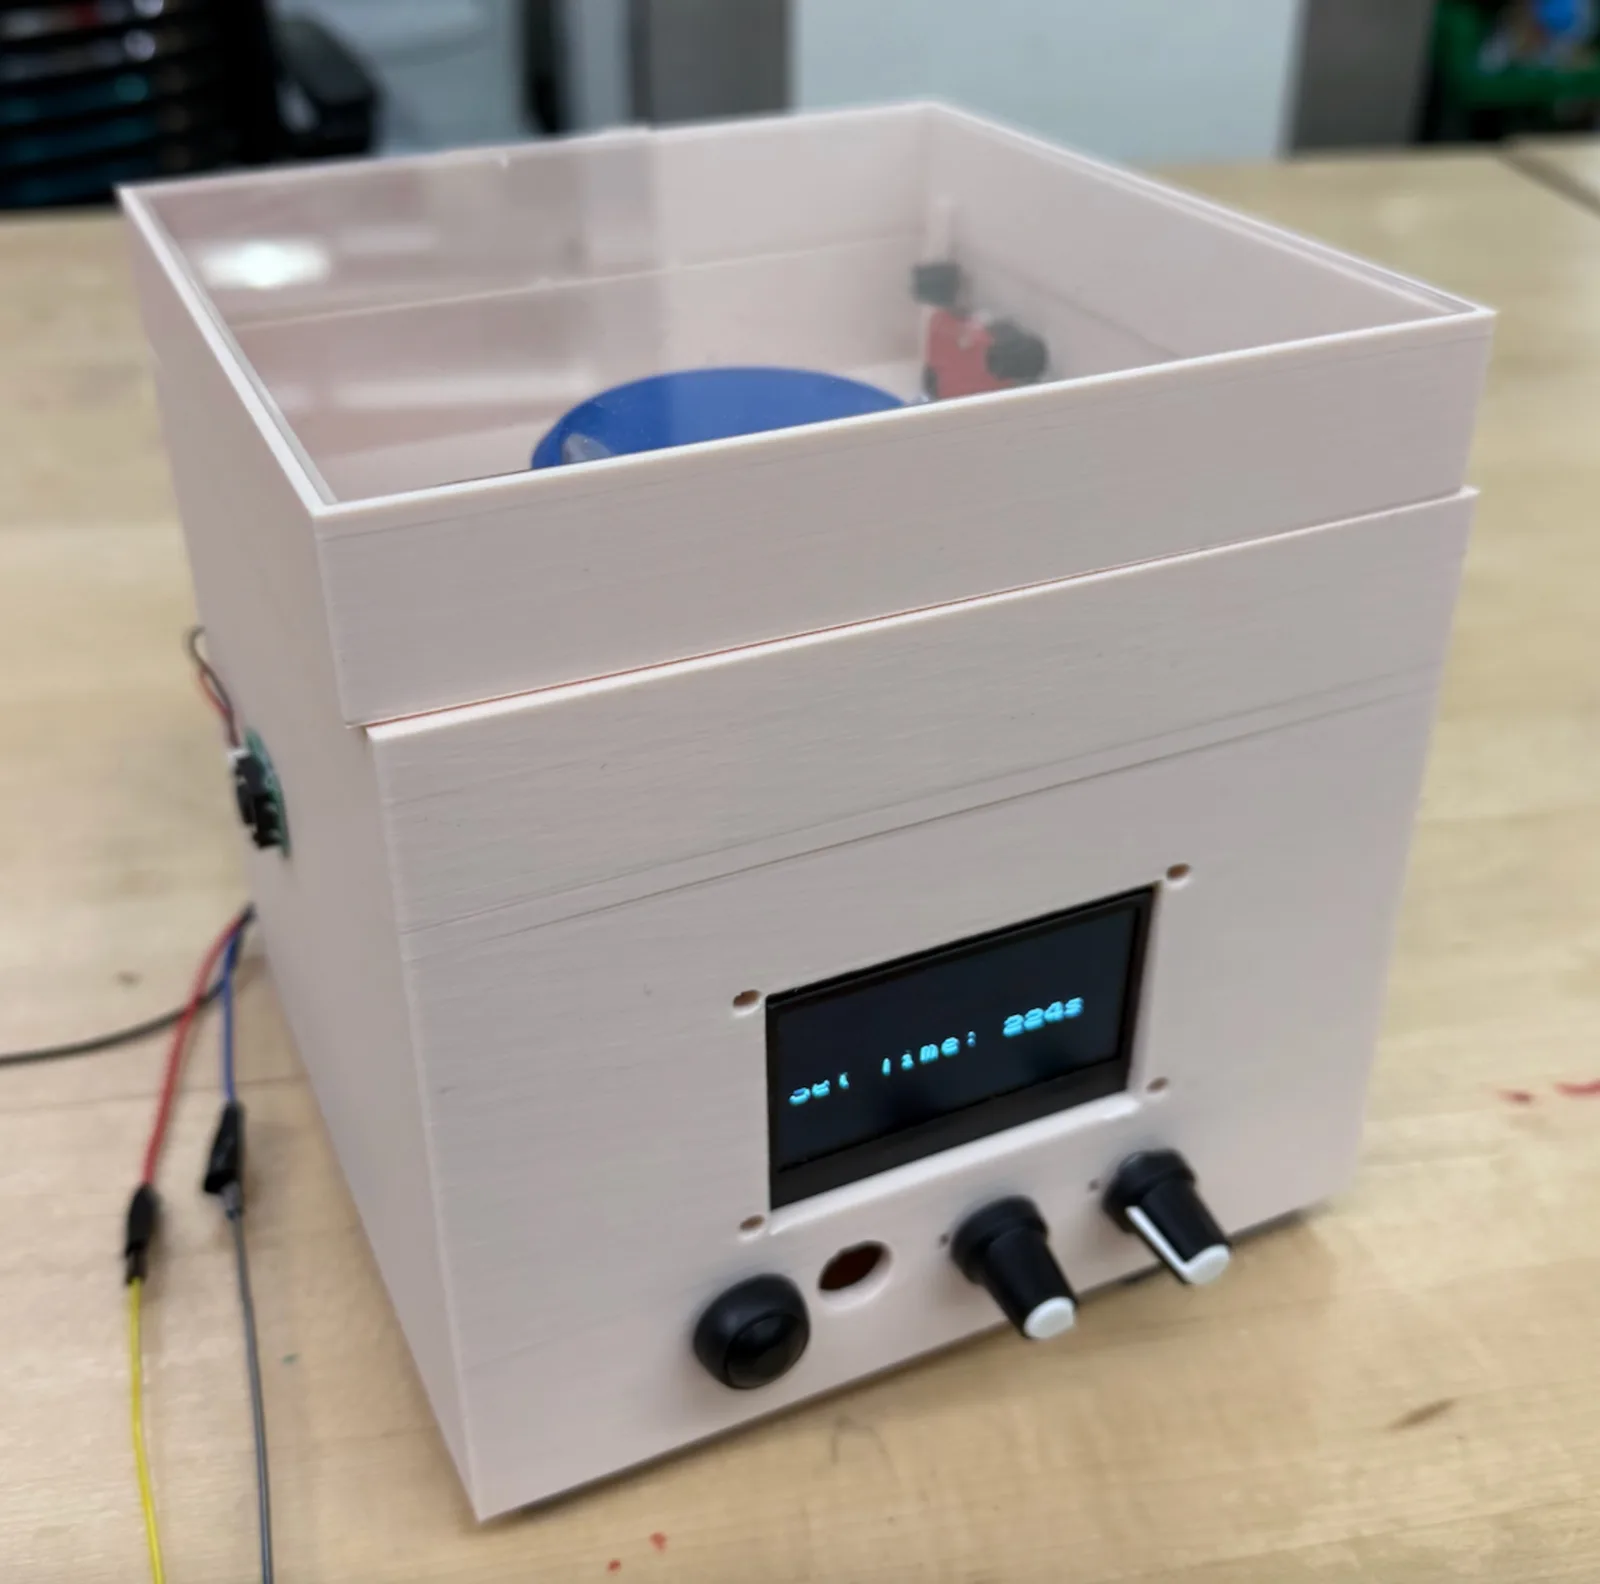
Centrifuge
Designed, built, and documented a safe and convenient centrifuge system capable of separate fluids such as blood.
Description
We created a centrifuge intended to be operated for laboratory procedures by undergraduate students with minimal training, for use in a desktop/at-home environment.
Learning Outcomes
1. General Project/Practical Skills
Systems Engineering: Hardware and software integration; full system design and bringup
Requirement Analysis: Defining product goals and creating a functional brief and requirements.
Documentation: Writing professional product reports and documenting development processes.
2. Technical Skills & Knowledge
- Electronics fundamentals
- Design, fabricate, integrate, and characterize practical electronic and mechanical hardware systems that meet clear requirements (i.e., build something that works)
- Prototype designs using tools and techniques, including: CAD, 3D printing, laser cutting, microcontrollers, oscilloscopes, and coding.
- Create quantitative system specifications and test measurement plans to demonstrate that a design meets user requirements.
- Communicate about design elements, choices, specifications, and performance through design reviews, demos, and written reports.
- Collaborate as a team member on a complex system design project (e.g., a centrifuge).
Demo
Here is an operator demo of the V3 system:
https://drive.google.com/file/d/18y70nMO5ZVp8TnJLP6V4Mf53VuGIvHBB/view?usp=sharing
The demo also showcases the system’s closed loop PID speed control and the system stopping on its own when the set timer runs out.
Here is a safety demo, showing the system not starting (and stopping) if the lid is not closed (based on the limit switch):
https://drive.google.com/file/d/1kqrG5GRL5SirUuz_T_YSzkTB7nYG6t8g/view?usp=sharing
Testing
All of our verification testing conditions and results can be accessed at the following trace matrix sheet: https://docs.google.com/spreadsheets/d/1AFH-9O8R5B5hVGK2Wr1u5LQf7YB4ekGW-rd-qXQY3z4/edit?usp=sharing
VALIDATION TESTING AND PLOTS
Centrifuge Verification PID Controller Test: Set speed to 500 to 3500 RPM with 500 RPM increment. Check whether the speed can be maintained with up to ~5% error for a minute.
We recorded our system’s reported (measured by the hall effect sensing subsystem and computed by the Arduino) and actual (real speed measured by the light tachometer) .
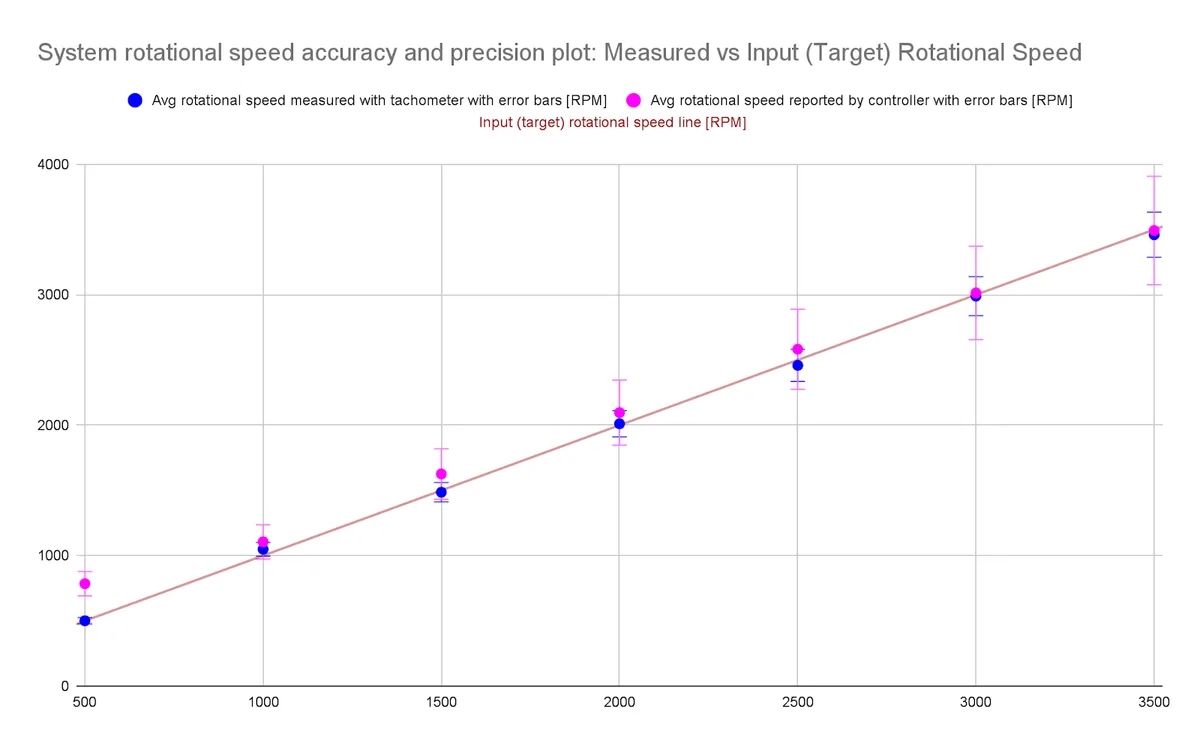
As given in Table: System rotational speed accuracy and precision testing (results recorded between 30 seconds and 2 mins to simulate transient response), for transient state, the system oscillates with the following properties (measured at 500 RPM intervals, between 500-3500 RPM).
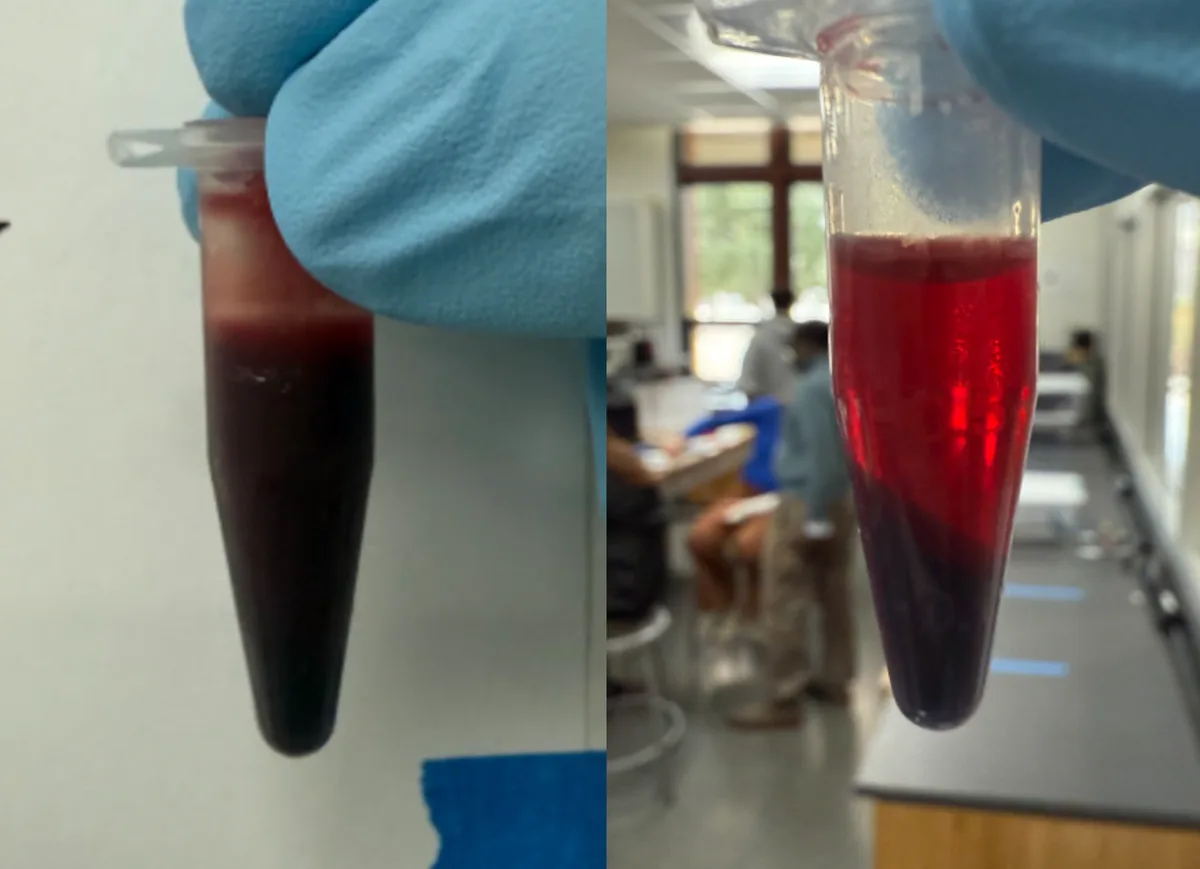
Centrifuge Validation Blood Separation Test: Load both containers and spin for up to 10 minutes. Visually inspect separation. PASS if layers (bottom to top) are red blood cells, buffy coat, plasma.
System Block Diagram
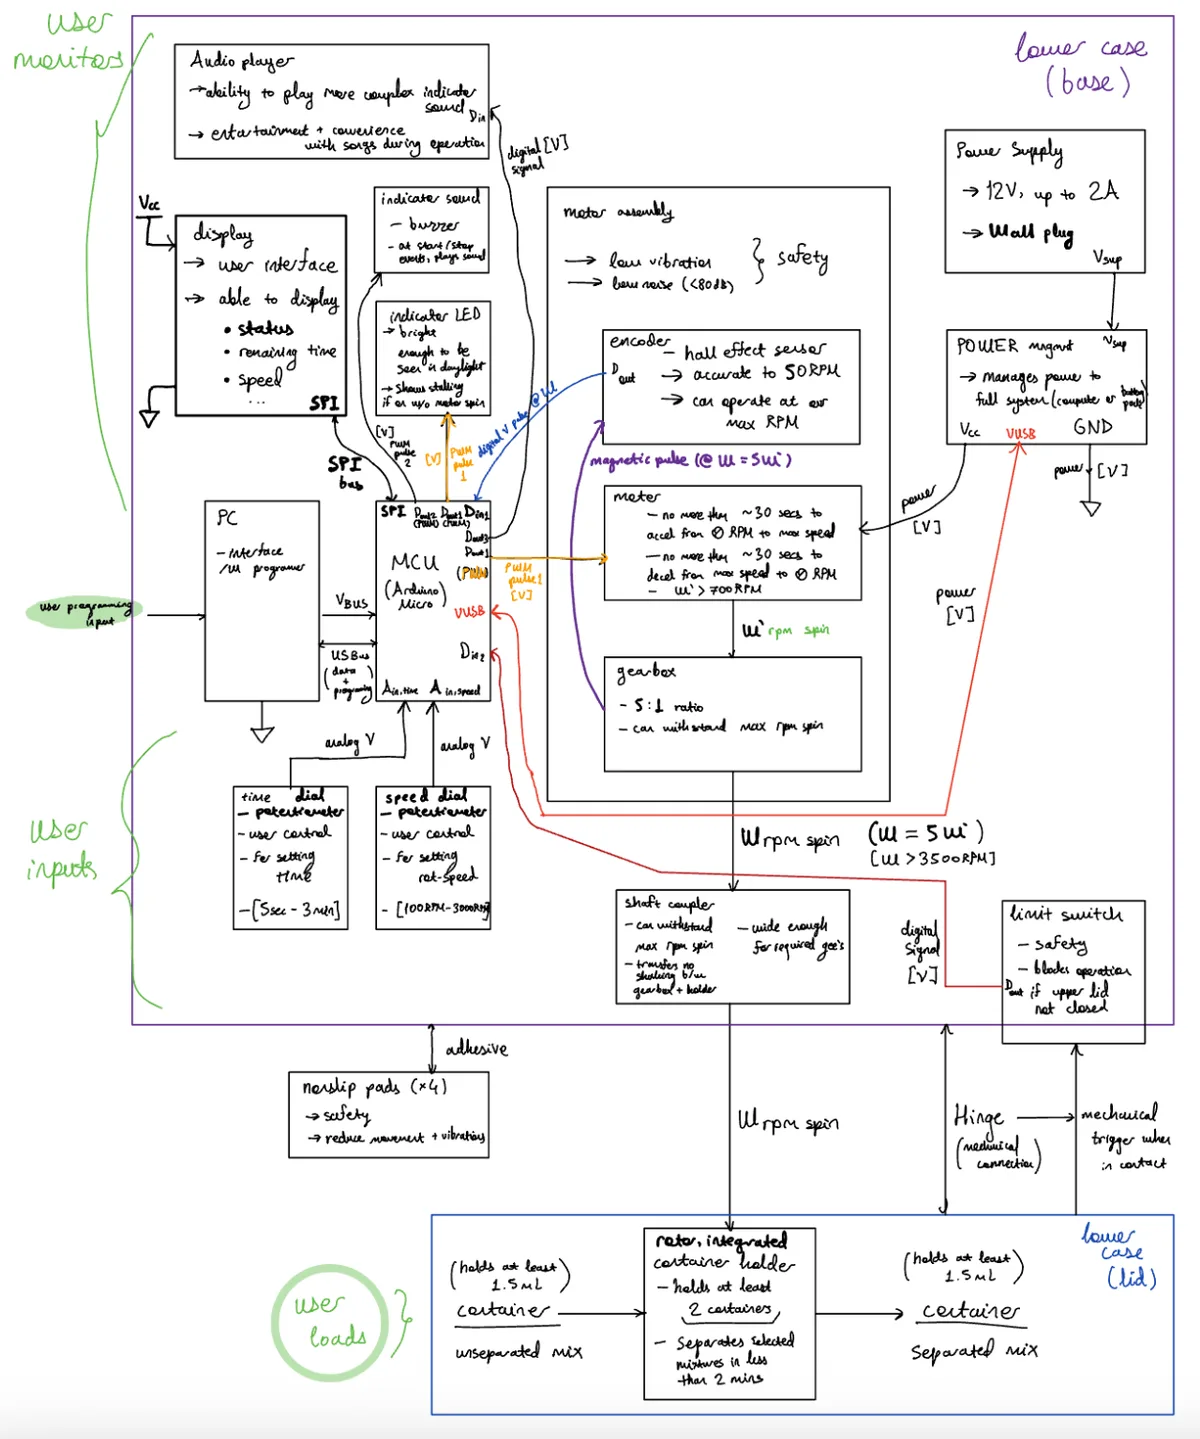
All inputs and outputs (with their units) are labeled with arrows.
User/operator interactions are highlighted in green. The block diagram illustrates how user inputs interact with control interfaces and mechanical components. The system features a user interface for status and settings display, an Arduino-based MCU for processing, and motor assemblies with Hall effect sensors for speed control. It includes a rotor-integrated holder for separating mixtures in containers, along with safety and power management features including an external case.
System Circuit Diagram
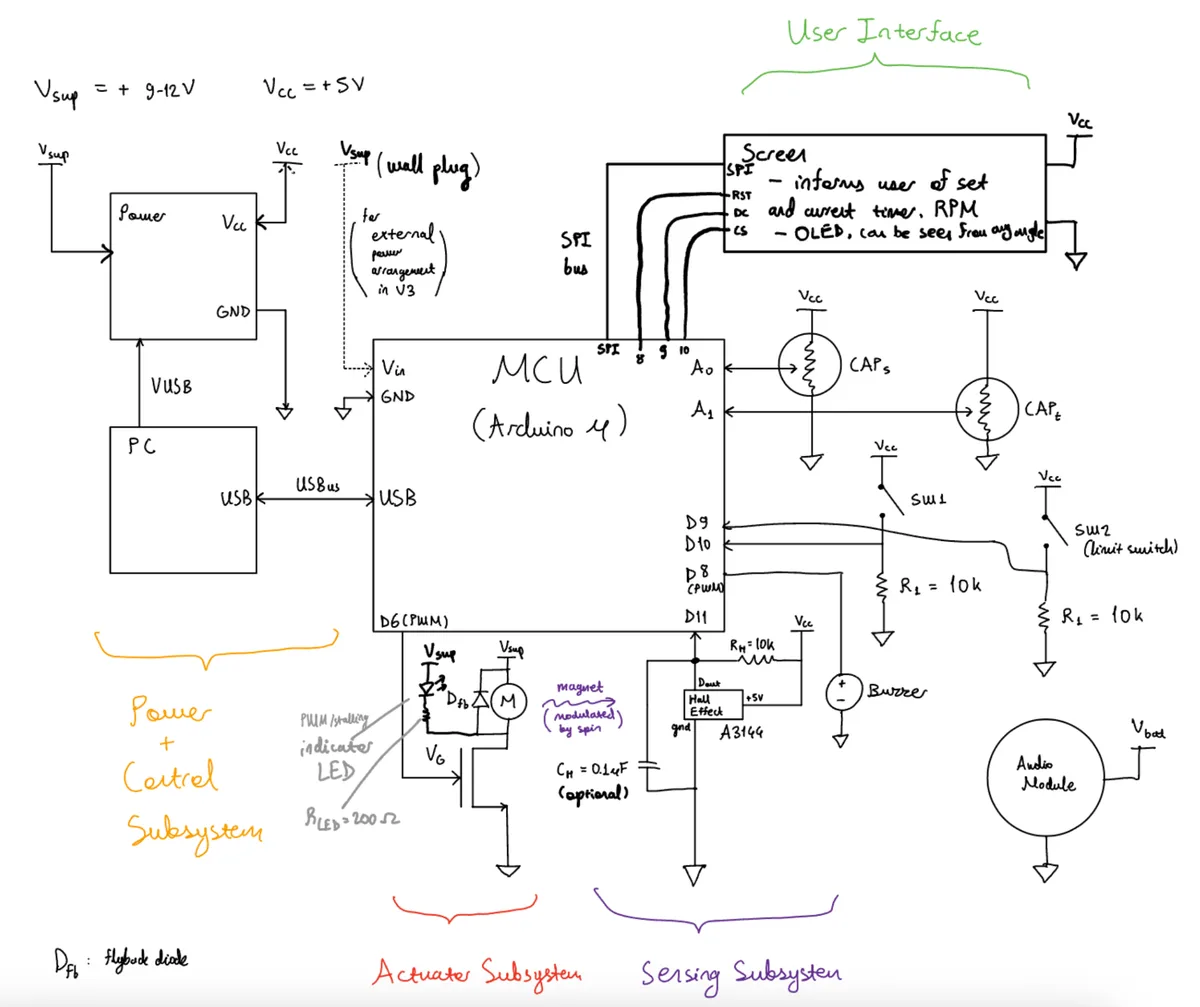
The diode parallel to the motor is an indicator LED, in our case, white. Schematic diagram of a centrifuge system's control architecture, featuring a user interface for setting time and RPM, an Arduino-based MCU for processing, and interconnected subsystems for power control, actuation (including a motor and PWM indicator LED), and sensing (with a Hall effect sensor and buzzer). The screen is controlled via a SPI bus (as opposed to I2C in our previous system). The actuator (and optionally the full system) is powered by a 9-12V supply regulated to 5V.
State Diagram (FSM)
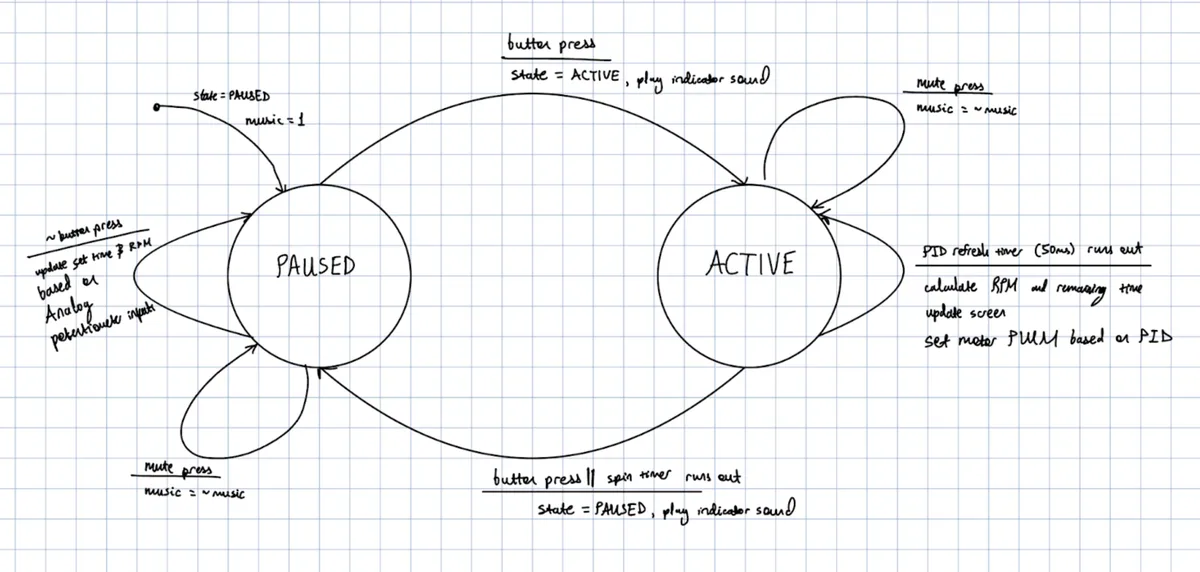
State diagram illustrating the operational states of a centrifuge system, transitioning between 'PAUSED' and 'ACTIVE' states. The system moves from PAUSED to ACTIVE with a button press, playing an indicator sound, updating set time and RPM based on analog input, and calculating RPM and remaining time. It returns to PAUSED when the button is pressed again or the spin timer runs out, also playing an indicator sound, with PID control refreshing every 50ms to set motor PWM and update the screen. Music can be muted and unmuted by pressing the mute button.
PID Control Loop
We use a closed loop control system enabling more fine and accurate control of the speed (RPM). The PID controller starts with user input into the Arduino. Input from the user is then converted into a PWM signal feed into the actuator subsystem that drives the gear motor leading to rotor base rotations. Each rotation is then picked up by the hall effect sensor as the magnet underneath the rotor base will trigger the sensing subsystem. Data regarding how fast the centrifuge is then fused into the controller for motor speed adjustment to achieve the desired RPM set by the user.
Attachments
Technical Documents
Design Cycle Main Documentation: centrifugeDesignCycleV3_EgeTuran
Requirements: BIOE123_Centrifuge_Requirements_2025
V3 Proposal: BIOE123_V3projectProposal_TeamA8
Troubleshooting Notes: Troubleshooting Best Practices Reflection/Sharing (Group) - A8
Team Bring Up Plan for V2, upon which V3 is built: BIOE123_V2bringupPlan_TeamA8
The V2 (V3 extends on it) - specific design, testing, and assessment processes can be found at:
BIOE123_V2centrifugeDesignCycle_TeamA8
BIOE123_V2mechanicalSubsystem_TeamA8
BIOE123_V2sensorSubsystem_TeamA8
BIOE123_V2actuatorSubsystem_TeamA8
BIOE123_V2controlSubsystem_TeamA8
The version-controlled code is available here: https://github.com/ege-turan/bioe123centrifuge
Shared Root Trace Matrix for V3 Centrifuge (Measurements are given in each section, or sheet page for each subsystem, linked tables are included in this sheet)
Linked here (living, updating): centrifugeDesignCycleV3traceMatrix
Presentation Slides: CentrifugeSystemPresentation_EgeTuran
GitHub